Debugging Cordova Apps
Part of any software development is being able to debug your code and Cordova applications are no different. By the end of this article, you'll know how to use the debugging tools available for debugging both iOS and Android Cordova apps.
Software Requirements
For debugging Android apps, you will need the latest version of Google Chrome.
For debugging iOS apps, you may need the Safari Tech Preview. Normal Safari that comes bundled with Mac OS may work just fine, but sometimes, particarly when iOS versions are just recently released, you need to use the Safari Tech Preview version to debug the latest iOS app.
Android
Google Chrome has debug tools available to remotely debug your Android Cordova app. That is, you debug from your workstation, while running the application on your device.
This works with either using a physical device or an Android emulator. If using a physical device, you'll need to have the device connected using a USB cable.
Turning on Debug features.
By default, debug features are disabled on the phone.
To enable debug mode:
- Open
Settings
- Open
About Device
- Scroll to
Build number
- Tap
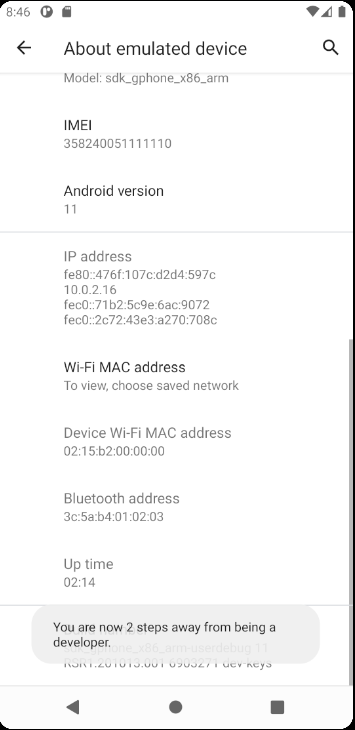
Build number repeatedly, until it says You are a developer.

Now, Developer Options options will appear in Settings > System.
Developer Options contains a large list of options that are helpful for developing and debugging applications. I like the Stay Awake option that makes phone stay awake as long as it's connected to an external power source. But the main thing we need is to turn on USB Debugging.

Now we are all set!
Debugging an Android Cordova App
Now that we have our device configured to allow debugging, we can start using Google Chrome's Web Inspector. It's important to know that only debug builds are debuggable. If you have an app build with the --release flag, these applications will not appear in the inspector.
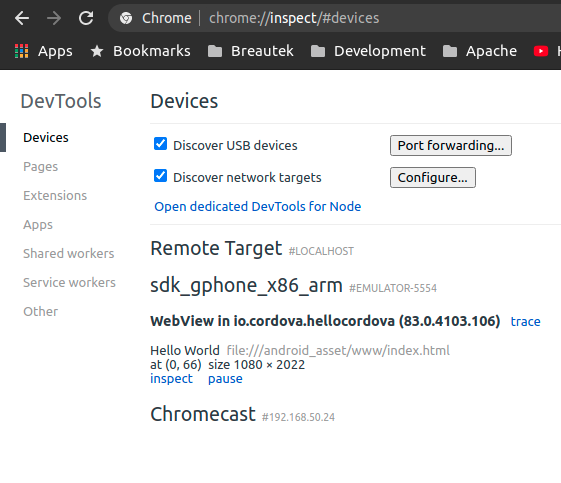
In Google Chrome on your workstation, open a new tab and go to chrome://inspect.

Your connected devices or emulators will appear here with any debugging webviews.
Clicking on Inspect will launch a remote debug connection to your webview. This will launch a new inspector window which has several tabs:
Elements
This will provide a view of the HTML DOM Tree. Clicking on HTML nodes will show you styling information. You can edit the styles inline, which can be useful for tweaking CSS until you get your view just right. Don't forget to carry over your changes to your source code!
Console
The JavaScript console shows console prints and error messages. It also allows you execute JavaScript. This can be useful for printing out variables. Tip: $0 will reference the selected node from the Elements tab.
Sources
Here the JavaScript sources can be viewed, and breakpoints can be set. When the JavaScript engine is paused on a breakpoint, you can play the code line by line. This is useful for debugging JavaScript execution.
Network
This tab will show all the network requests the webview is making. You can inspect the Header and the request body, as well as the response headers and body.
This tab allows you to record a performance audit. Useful to isolate the cause of slow performing code. Just start recording, then do the slow action on the device, then stop recording. A performance report will breakdown all the JavaScript code being executed as well as how much time is being spent in each function, among other timing details.
iOS
Debugging iOS applications is very similar to debugging Android applications. Safari has it's own web inspector that can remotely connect to webview running on the iOS simulator or a physical device connected by USB.
Enabling Debug Mode
Like Android, we first have to enable debugging. On the iOS device*:
- Open
Settings
- Open
Safari
- Open
Advanced
- Enable
Web Inspector
*Note that this option may not appear if you're running iOS on a simulator.
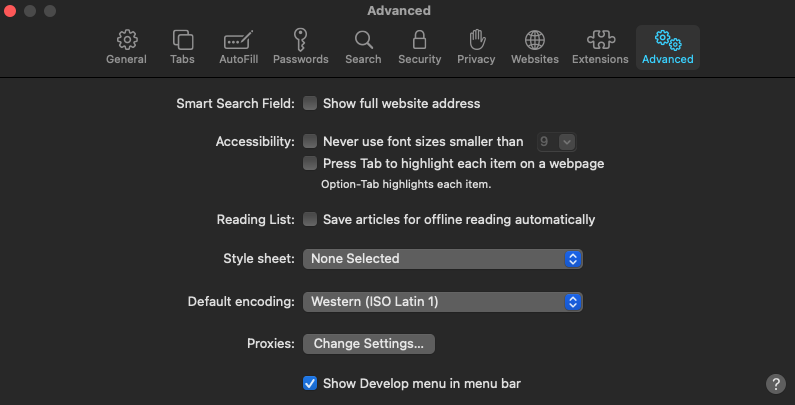
We'll also need to enable the Developer menu item in Mac Safari:
- Open Safari's
Preferences
- Open the
Advanced tab
- Enable
Show Develop menu in menu bar

Now we're set!
Debugging an iOS Cordova App
Like Android Cordova apps, iOS Cordova apps can only be debugged if running a debug version of your application. Using a release mode built with the --release flag will not appear in the inspector menu.
With your app running, your device & debuggable webviews will now appear in Develop menu.

Tip: If using a physical device, running a debuggable version of your app is listing your app/webview, you may need to use the Safari Tech Preview instead of the regular Safari Mac app.
The Safari Web Inspector contains all similar tabs and features as the Google Chrome's Web Inspector. View the Android documentation for a rundown of each tab.
Tip: Unlike Google Chrome's Web Inspector, Safari's Web Inspector doesn't capture console events that occurred before the inspector was attached. This is problematic if you're trying to debug a problem that occurs on webview startup. A workaround is to refresh the webview, which can be done by pressing cmd + R while having the Safari Web Inspector focused.
About the author

Norman Breau is an IT professional with over 10 years of field experience.
He has a wide range of skill sets, ranging from web & software development &
architecture, to Server & Database administration. Presently he works at
TotalPave where he plays
a lead role in software projects as well as manages the server infrastructure.
On his own time, he volunteers to some open source projects, namely Apache Cordova, as many projects
throughout his career were dependent on the Cordova project. Open source projects works the best when there are volunteers that depend on such software is able to contribute in some form.
Additionally, he has been working on a newer project called Fuse,
a framework for building native-web hybrid mobile applications. The framework
intends to fill a void somewheres between CapacitorJS and pure native development.
Fuse is simply just a native library, with a bundleable webview JS API.
Unlike Cordova and CapacitorJS, Fuse is more tailored to native developers,
who want to still utilise the webview for their application's UI but retain
full control over the native project and native code. The only requirement
is that Fuse needs to be installed in the application along with a compatible
Fuse JS runtime. Fuse offers the webview and a bridging API that natively
supports binary and is incredibly fast.
Like all websites, web hosting costs money. If the above article has helped you, please considering offering a small tip as a token of appreciation.

